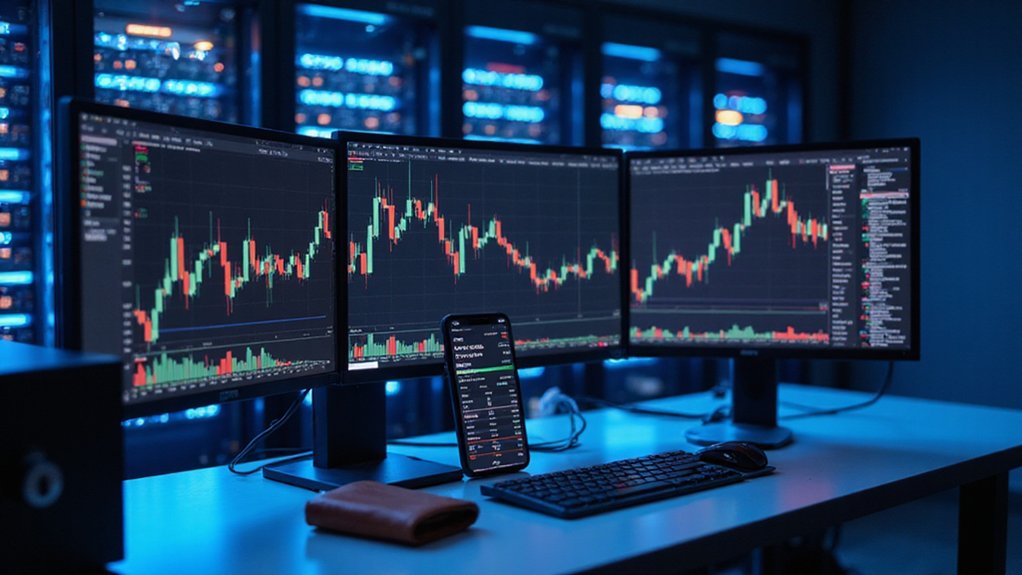

Candlestick charts offer crypto traders a visual shorthand for market psychology. Each candle—comprising body and wicks—encapsulates price movement within a specific timeframe. Green bodies signal bullish momentum; red indicates bearish pressure. Long upper wicks reveal selling at higher prices, while extended lower shadows suggest buying during dips. Common patterns like dojis (market indecision) and engulfing formations gain significance when interpreted alongside volume and support/resistance levels. These visual narratives, properly decoded, transform chaotic price action into actionable intelligence.
Why do seasoned crypto traders fixate on those colorful bars that populate their charts?
These seemingly simple configurations—candlesticks—offer remarkably nuanced glimpses into market psychology, conveying price action’s entire narrative through elegantly efficient visual shorthand.
Candlesticks transform complex market psychology into visual poetry—each formation a precise chapter in price action’s unfolding story.
Each candlestick, with its distinctive body and protruding wicks (or shadows), encapsulates four critical price points: the open, close, high, and low during a specific timeframe—be it five minutes or an entire day.
The crypto market’s perpetual nature—unlike traditional exchanges with their quaint closing bells—means these candlesticks capture uninterrupted trading sentiment across global time zones. Understanding these visual representations helps traders identify market sentiment and make more informed decisions in the volatile cryptocurrency market.
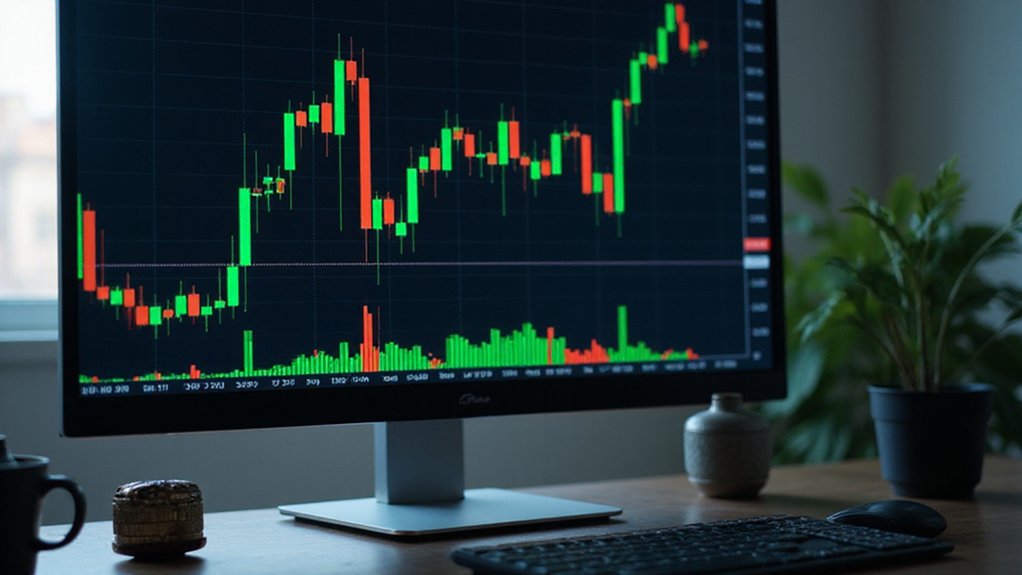
Green bodies signal bullish momentum (price increased), while red indicates bearish pressure (price decreased). On platforms like Coinbase Pro, these candlesticks typically display in a six-hour timeframe with five-minute divisions.
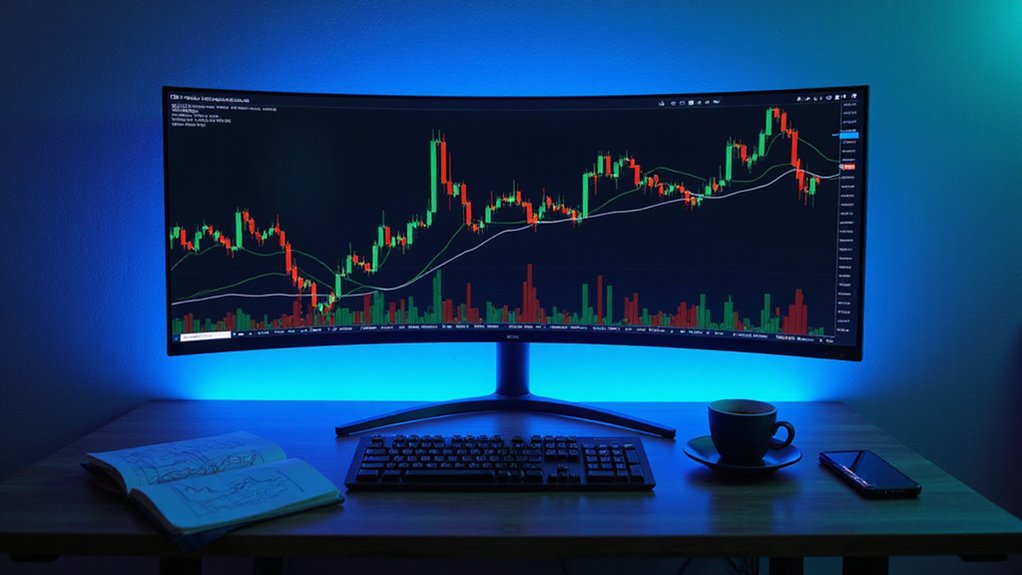
The comparative size of these bodies speaks volumes; substantial green candles suggest robust buying pressure, while lengthy red ones reveal aggressive sellers dominating the session.
Those thin lines extending from candlestick bodies—the wicks—warrant particular attention.
Long upper shadows reveal rejection at higher prices (sellers stepping in), while extended lower wicks indicate buyers appearing during price dips.
When examining patterns, traders recognize that formations rarely exist in isolation.
A bullish engulfing pattern (where a green candle completely overwhelms its preceding red counterpart) gains significance when appearing after a prolonged downtrend.
Doji candles—those with minimal bodies resembling crosses—signal market indecision, often presaging reversals when confirmation follows.
The hanging man and hammer patterns, distinguished by their small bodies and long lower wicks, can mark trend exhaustion points worthy of scrutiny.
Most sophisticated traders enhance candlestick analysis with complementary indicators; moving averages confirm trends, while oscillators like RSI identify overbought or oversold conditions.
Volume correlation remains essential—substantial volume accompanying a pattern lends it credibility, while patterns forming during anemic trading warrant skepticism.
For traders seeking further insights, many platforms are temporarily experiencing restrictions due to new UK rules, but they actively work to restore full access to educational resources.
The true power of candlestick analysis lies not in isolated formations but in contextual interpretation—understanding how patterns interact with support/resistance levels, trend lines, and market structure to reveal probable (never certain) price trajectories in the notoriously capricious crypto landscape.
Frequently Asked Questions
How Do Candlestick Patterns Perform During Extreme Market Volatility?
Candlestick patterns become significantly less reliable during extreme market volatility, with success rates dropping from their typical 62-66% range in stable conditions.
Traditional formations like Morning Star and Bullish Abandoned Baby often generate false signals as erratic price swings distort pattern integrity.
Bearish reversal patterns exhibit more pronounced—though not necessarily more accurate—movements, while indecision patterns (Dojis, Spinning Tops) proliferate amid the chaos.
Savvy traders compensate by combining candlestick analysis with volatility indicators and multiple timeframe confirmation.
Can Candlestick Analysis Be Automated With Trading Bots?
Candlestick analysis can indeed be automated with trading bots, though with varying degrees of sophistication.
Platforms like Cryptohopper and 3Commas offer built-in tools for incorporating candlestick patterns into automated strategies, while more complex implementations may require advanced programming or machine learning algorithms.
The efficacy of such automation hinges on the bot’s ability to correctly identify patterns amid market noise—a feat that remains imperfect even with today’s technological capabilities.
How Do Candlesticks Differ Between Traditional Markets and Cryptocurrency Markets?
Candlesticks in crypto markets reflect the same basic structure as traditional markets but operate within a distinctly different ecosystem.
While both use identical visual representations, crypto candlesticks capture 24/7 trading volatility—a stark contrast to traditional markets’ scheduled sessions.
Consequently, crypto charts often display more erratic patterns and extreme wicks, sometimes bordering on the absurd.
The interpretation remains consistent across both domains, though crypto traders must contend with heightened volatility and sentiment-driven movements.
What Timeframes Work Best for Candlestick Analysis in Crypto?
For candlestick analysis in crypto, timeframes must align with trading intentions.
Day traders excel with 1-15 minute charts for capturing rapid fluctuations, though they’re admittedly noise-prone.
Swing traders find equilibrium in 30-minute to hourly timeframes, while position traders benefit from 4-hour to daily charts that filter market randomness.
Daily candlesticks historically demonstrate superior performance metrics—higher win ratios and profit factors—although crypto’s 24/7 nature means volume patterns differ from traditional markets’ opening bell rhythms.
How Reliable Are Candlestick Patterns Compared to Other Technical Indicators?
Candlestick patterns offer immediate visual insights into market psychology that quantitative indicators cannot, though their reliability remains a double-edged sword.
While patterns like Engulfing and Doji have demonstrated statistical merit, crypto’s notorious volatility renders them less dependable in isolation than in traditional markets.
Prudent traders view candlesticks as complementary rather than superior to momentum indicators (RSI, MACD), recognizing that confirmation across multiple technical approaches—rather than singular reliance—yields best results in the digital asset wilderness.