
Reading cryptocurrency charts like a pro requires mastering five essential elements: candlestick formations that reveal market psychology through color-coded price movements; appropriate timeframes paired with volume analysis to verify price actions; technical indicators like RSI and MACD to identify momentum shifts; recognition of chart patterns and support/resistance levels; and disciplined risk management strategies. The combination of these elements transforms cryptic price data into actionable intelligence—a skill that separates casual observers from those who consistently navigate the market’s capricious tides.
Why do so many investors find themselves bewildered by the seemingly indecipherable labyrinth of cryptocurrency charts? The answer lies not in their complexity per se, but rather in the unfamiliarity most have with the visual language of technical analysis—a dialect fluently spoken by seasoned traders who navigate volatile markets with remarkable sangfroid.
The cryptocurrency chart: not inherently complex but written in a technical dialect most investors have yet to master.
Cryptocurrency charts fundamentally represent the perpetual tug-of-war between market participants through several key elements.
The ubiquitous candlestick formation—those rectangular bodies with extending wicks—telegraphs vital price information: green candles (signaling bullish momentum) and red ones (bearish retreat) provide an instant visual narrative of market psychology.
Each candle, a temporal snapshot of trading activity, contains four data points: the opening price, highest reached, lowest descended, and closing value. The real body of the candlestick visually displays the difference between opening and closing prices, making market sentiment immediately apparent.
Discerning professionals recognize that no chart exists in isolation.
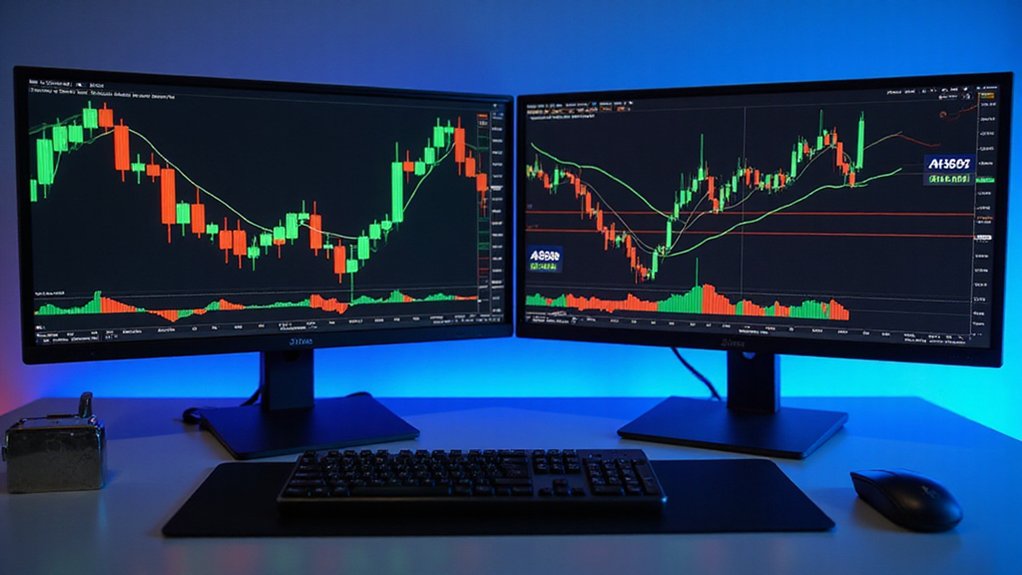
Timeframes—whether minute-by-minute for day traders or weekly for position strategists—dramatically alter interpretations.
Volume bars beneath price action serve as verification mechanisms; substantial price movements occurring on anemic volume often presage reversals (a fact routinely ignored by neophytes to their eventual chagrin).
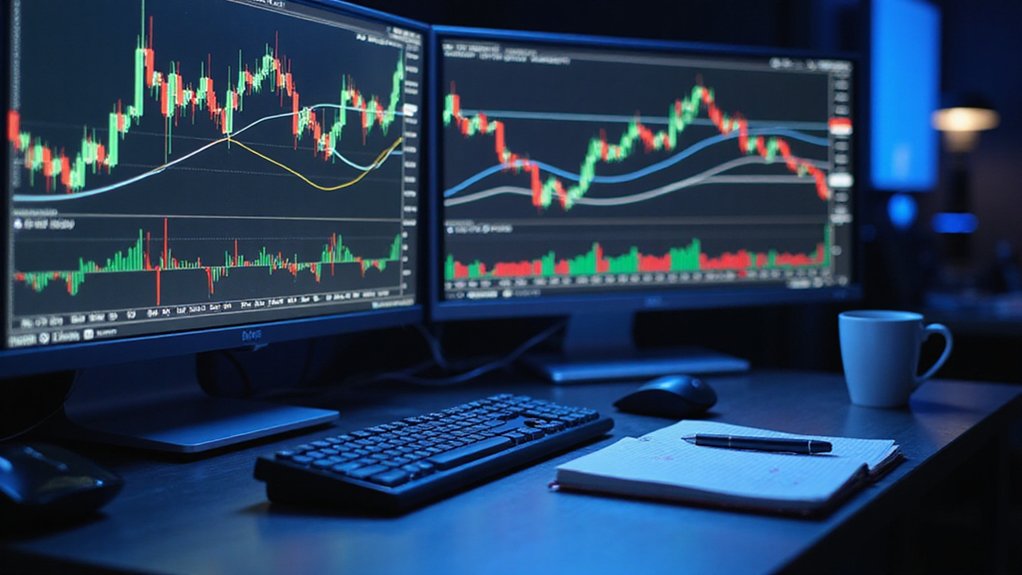
The astute analyst’s arsenal includes multiple indicators.
RSI identifies overbought or oversold conditions.
MACD reveals momentum shifts through converging and diverging averages.
Bollinger Bands—those floating channels surrounding price—quantify volatility with mathematical precision.
Chart patterns—those triangles, wedges, and head-and-shoulders formations—emerge from seemingly random price movements, offering probabilistic forecasts of future direction.
Support and resistance levels function as gravitational fields, repeatedly attracting or repelling prices at historically significant thresholds.
Moving averages—those sinuous lines traversing the chart—smooth price noise and provide dynamic support/resistance zones. Traders particularly value the EMA because it gives more weight to recent prices, making it responsive to current market conditions.
Fibonacci retracements (derived from that curious mathematical sequence found throughout nature) offer potential reversal zones with remarkable accuracy.
When combined with judicious risk management—placing strategic stop losses and take profits—chart reading transcends mere analysis to become a disciplined methodology.
The chart, properly interpreted, transforms from inscrutable hieroglyph to illuminating map, guiding the informed investor through cryptocurrency’s notoriously tempestuous waters.
Trend lines connect successive price points to reveal the market’s directional strength, with greater numbers of connected points indicating stronger trend patterns that can help predict potential breakouts or reversals.
Frequently Asked Questions
What Is the Best Time Frame for Cryptocurrency Trading?
The “best” timeframe for crypto trading doesn’t exist in any absolute sense—it’s fundamentally contingent on one’s trading style and objectives.
Scalpers gravitate toward 1-5 minute charts, while day traders find utility in 15-minute to hourly intervals.
Swing traders, perhaps wisely avoiding the minute-by-minute psychological rollercoaster, prefer 4-hour and daily charts.
Position traders and investors (those rare creatures with actual patience) find weekly and monthly charts most illuminating for capturing macro trends that transcend daily noise.
Can Technical Analysis Predict Market Manipulation?
Technical analysis, while adept at identifying patterns, remains limited in predicting market manipulation.
Sophisticated schemes often create false signals that deceive even seasoned analysts.
While combining multiple indicators (RSI with MACD, for instance) and monitoring abnormal trading volumes can flag suspicious activity, manipulation’s increasingly complex nature outpaces reactive measures.
Cross-platform monitoring shows promise, yet the fragmentation of cryptocurrency markets creates blind spots that manipulators exploit with remarkable efficiency.
The cat-and-mouse game continues, unabated.
How Do Whale Movements Affect Cryptocurrency Charts?
Whale movements manifest on cryptocurrency charts through distinctive patterns—dramatic price candles, volume spikes, and disrupted order book depth.
These leviathans of liquidity create characteristic signatures: sudden vertical price wicks during large buy/sell operations, widened bid-ask spreads following exchange deposits, and anomalous trading volume disconnected from broader market patterns.
Savvy analysts monitor exchange inflow metrics and wallet-to-exchange transfers specifically to anticipate these chart distortions, which often precede significant trend reversals or short-term volatility events that technical indicators alone fail to forecast.
Which Chart Patterns Have Highest Success Rates?
Among chart patterns, support and resistance breakouts consistently demonstrate the highest success rates—often exceeding 75%—when properly identified and traded.
Bullish and bearish flags follow closely as reliable trend continuation indicators.
Head and shoulders patterns, while more complex to identify, offer impressive predictive power for reversals.
The efficacy of these patterns increases substantially when combined with confirmation indicators and deployed within appropriate market contexts rather than in isolation.
Should I Prioritize Volume or Price Action?
Prioritizing between volume and price action requires nuanced consideration rather than an either/or approach.
Effective traders integrate both: price action reveals market direction and potential reversal points, while volume confirms the strength and validity of these movements.
In volatile crypto markets, price action without corresponding volume may prove ephemeral—merely sound and fury signifying nothing.
Context ultimately dictates emphasis; short-term traders might weight volume more heavily, while long-term investors often prioritize sustainable price action patterns.